Diagrams As Code
Section 06 · Lesson 3 · Level: beginner · ~18 min · Prereq: Thinking in boundaries
Why this matters
A drawing in a design tool is a picture nobody can diff, so it goes stale the week after it is made. A diagram written in text lives next to the code, appears in the pull request, and shows up in review as a change you can read.
Why diagram-as-code beats a picture
Text diagrams live with your source, so they travel with the branch, the review and the history. When a table gains a column, the diagram change is a line in the diff, and a reviewer who disagrees edits the text instead of re-exporting a PNG.
The rule that makes this work: the diagram is a summary, not the source of truth. Keep it small enough to fit in a diff, and update it in the same pull request as the change.
Mermaid: four types, four jobs
GitHub renders Mermaid inside a fenced block tagged mermaid. Four types cover almost everything:
flowchart(graph) for process and structure — what talks to what.sequenceDiagramfor interactions in time — who calls whom, in what order.stateDiagram-v2for lifecycles — the legal states of one thing.erDiagramfor schemas — tables, keys and relationships.
Two worked examples follow. Both are real shapes, and both are short on purpose.
A schema, as an erDiagram
erDiagram
    CUSTOMER ||--o{ ORDERS : places
    ORDERS ||--|{ ORDER_LINE : contains
    PRODUCT ||--o{ ORDER_LINE : "appears in"
    CUSTOMER {
        uuid id PK
        text email "unique and case-insensitive"
        timestamptz created_at
    }
    ORDERS {
        uuid id PK
        uuid customer_id FK
        numeric_18_2 total "exact decimal, never a float"
        text status "constrained by a CHECK"
        timestamptz placed_at
    }
    PRODUCT {
        uuid id PK
        text sku "unique"
        numeric_18_2 unit_price
    }
    ORDER_LINE {
        bigint id PK
        uuid order_id FK
        uuid product_id FK
        int quantity
    }
Read the arrows as sentences: a customer places zero or more orders, an order contains one or more lines, a line points at exactly one product. The || end is the "exactly one" side and the o{ end is the "zero or many" side.
A lifecycle, as a stateDiagram-v2
stateDiagram-v2
    [*] --> Draft
    Draft --> Placed: customer submits
    Placed --> Paid: payment confirmed
    Placed --> Cancelled: customer cancels
    Paid --> Shipped: warehouse picks
    Shipped --> Delivered: carrier confirms
    Delivered --> Refunded: return accepted
    Delivered --> [*]
    Cancelled --> [*]
    Refunded --> [*]
The states are the nouns, the labelled arrows are the events, and [*] is the start and the terminal state. Two things are immediately checkable: nothing returns from Delivered to Placed, and Cancelled cannot come back. If your code disagrees with the picture, one of them is a bug.
C4 in plain language
C4 is a naming scheme for diagrams at four zoom levels. You need the first two.
- Context — your system as one box, with the people and outside services it talks to. Five boxes maximum. Useful for a README.
- Container — the pieces you deploy: web client, API, database, background worker. This is the diagram you draw when a new contributor joins.
- Component and Code — the modules inside one container, and the classes inside those. Usually skippable: that is what your boundary diagram and folder structure are for.
- Code — classes and functions. Never draw this by hand.
Pick one level per diagram. The commonest bad diagram is a container-level picture with two tables and a function call squeezed into it.
Diagram hygiene
Three habits make diagrams useful rather than decorative:
- Label the trust boundary. Draw a line where data stops being untrusted — the public endpoint, the provider callback, the admin route. Most security bugs live on the wrong side of an unlabelled line.
- Point arrows in the direction of control or data flow, and say which. An arrow that means "depends on" in one place and "calls" in another is worse than no arrow.
- Draw the failure paths. Timeout, duplicate delivery, partial success. A diagram with only happy paths is a wish, and the failure paths are where the state machine lives (State machines for real features).
Making it a habit
Use the planning rule: if a feature has state that survives a restart, draw its state machine before you write code, and commit the diagram in the same branch. Include it when you ask an agent for a change: it is cheaper context than three files of prose.
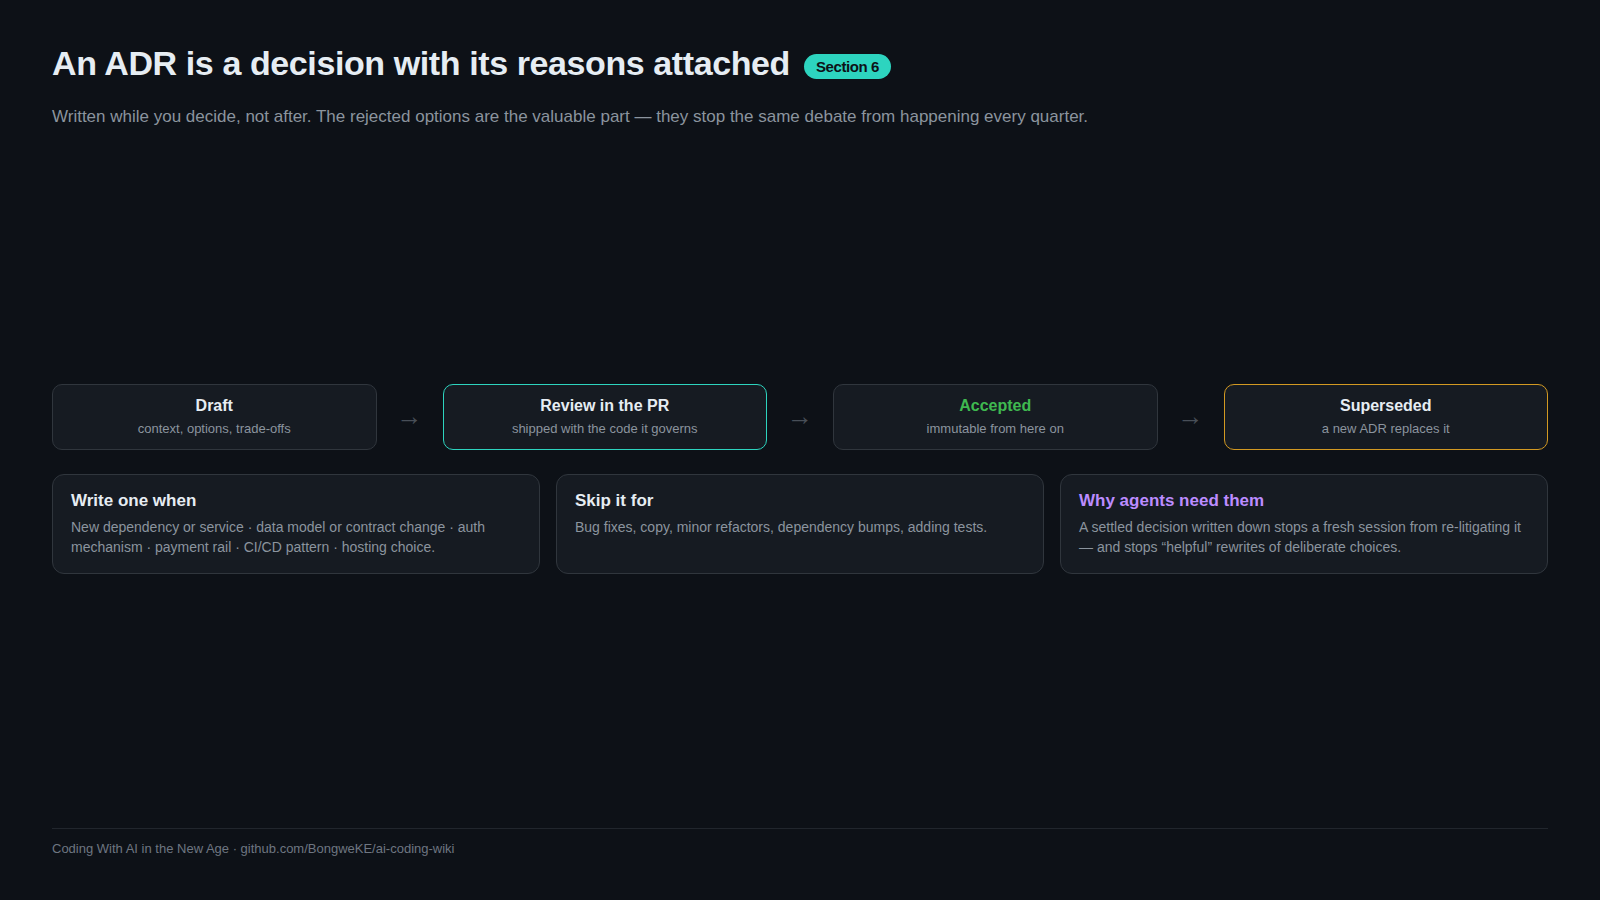
Diagrams and decision records are two halves of one habit. A picture with no decision behind it rots quietly; the lifecycle below shows how a recorded decision is proposed, reviewed and later superseded.
Try it
- Create
docs/diagrams/and draw a context diagram for your project: your app, its users, and every outside service, as oneflowchart. - Add an
erDiagramfor your three most important tables. Mark keys and note one constraint per table. - Ask the agent: "Read
docs/diagrams/orders.md. List every state transition in the code that is not in the diagram." Fix whichever is wrong. - Commit the diagrams in the same branch as your next feature and reference them from the pull request description.
Common mistakes
- Pasting a screenshot from a design tool. It cannot be diffed, reviewed or edited.
- One diagram that does everything. Twenty boxes with four kinds of arrow is unreadable.
- Unquoted labels with punctuation.
A[Verify (twice)]can break the parser; writeA["Verify (twice)"]. - Showing only the happy path. If every arrow succeeds, the diagram hides the retries and duplicate callbacks that cause the incidents.
- Updating the diagram and never the code, or the reverse. Whichever is stale will be believed, so change both in one pull request.
Key takeaways
- Diagrams as code diff, review and live next to the code; a picture does not.
- Match the Mermaid type to the job: flowchart for structure, sequence for interaction, state for lifecycles, erDiagram for schemas.
- C4 gives you two useful zoom levels, context and container. Anything deeper is a folder structure.
- Label the trust boundary, the arrow's meaning, and at least one failure path on every diagram.
- Stateful features get a state machine before code, and the diagram ships in the same branch.
Further learning
- Mermaid cookbook — copy-paste snippets for each diagram type and the syntax traps.
- State machines for real features — turning a lifecycle diagram into guards, tests and idempotent transitions.
- Architecture decision records — the written half of the same habit.
- Docs as code — keeping diagrams, decisions and documentation in the repository beside the code.
- Anthropic engineering — how compact, structured context changes what an agent gets right.